
Process
Flow
Diagram
Security &
Confidentiality
We place a high value on confidentiality and security. As a result, we provide each of our clients with their own private upload and download URLs and passwords on our local server. If you want to learn more about how we exchange documents, follow the link below:
Do you want to
Request an offer?
Thank you in advance for the interest you show in our company. The easiest way to request an offer is to contact us and discuss the details via e-mails or on the phone. You can contact us by clicking here:
EXAMPLES FROM PREVIOUS projects:
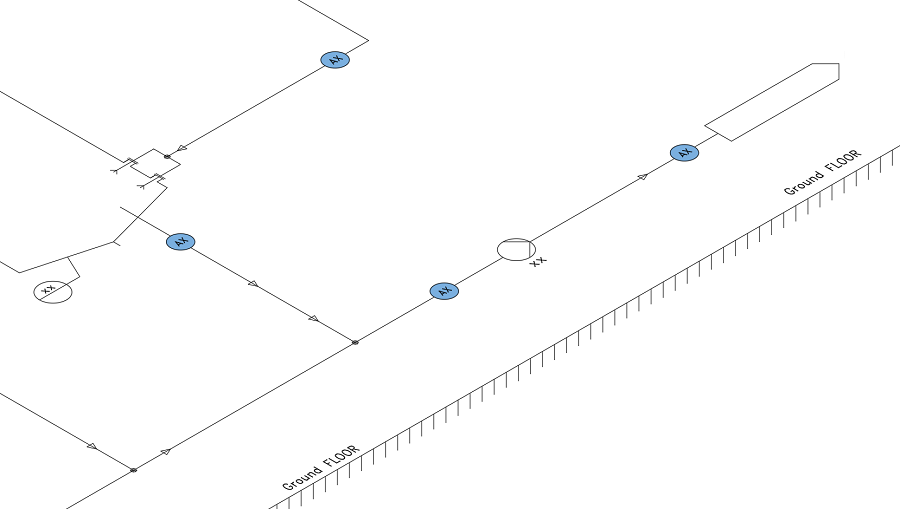
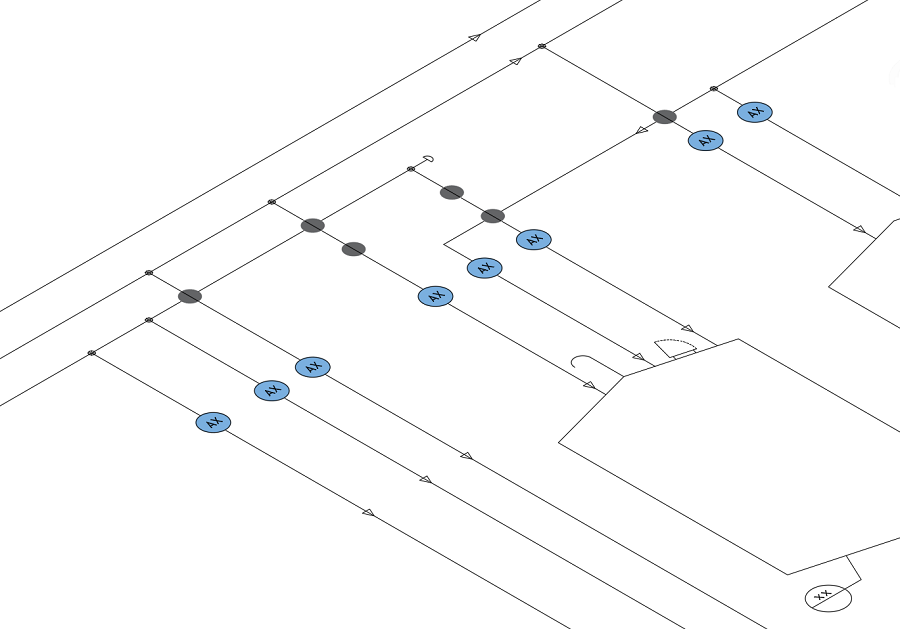


What the PFD we hand over contains
The process flow diagram fixes what the installation has to do. Everything else follows from it, including the errors.
The diagram
Main equipment tagged, material and utility flows, operating conditions at the characteristic points. Established to your own coding and symbols — or to ISO 10628-1 for the content and ISO 10628-2 for the symbols, if you do not yet have one.
The material and heat balance
Flow rates, compositions, temperatures and pressures at the balance points, as a table attached to the diagram.
The assumptions retained
Efficiencies, margins, operating cases considered. A balance delivered without its assumptions cannot be checked, and therefore cannot be used to decide.
The operating cases
Normal, start-up, shutdown, degraded operation — as soon as they change the sizing of an item of equipment or of a line.
The formats
DWG and PDF, or your native format if your document system requires one.
Where a process flow diagram starts
Most of these starting points begin from an installation already built — the most frequent situation among our clients.
From a scope of work
The case of a new unit: the diagram turns the intention into flows, equipment and operating conditions.
From an existing P&ID
Working back from the detail to the process. This is frequent: many installations have P&IDs and no PFD, or a PFD that never followed the modifications.
From a 3D model
The process is reconstructed from what was built, when the model has become the most up-to-date document on the site.
From a 3D survey
The same approach, when the model itself does not exist and the starting point is the point cloud and the inspection.
For an extension
The diagram of the existing plant becomes the basis the extension connects to, with the boundary conditions that go with it.
As-built, after the works
The diagram brought back onto the state actually built, from the final P&ID, the model or a survey.
A false assumption that passes unnoticed here propagates to the P&IDs, then to the diameters, then to the equipment, and ends up as extra material cost several months later.
That is why we make the assumptions explicit and ask for them to be validated before moving down to the P&ID. On our own projects, revisions of the process diagram made after the P&IDs have been established consumed 4.5 hours per diagram against 1.1 hour budgeted, across twenty-seven projects analysed.